OppHub America Desk · · Source: yahoo-tickers-tape-movers
S&P 500 Valuation Signals Warning: History Suggests Volatility Ahead
Investors seeking to navigate potential market volatility might consider focusing on quality stocks that have historically demonstrated resilience through various market cycles. The long-term performance of the S&P 500 suggests that while short-term fluctuations are likely, sustained investment in well-chosen companies can lead to positive outcomes over extended periods.
Based on reporting from yahoo-tickers-tape-movers.
The S&P 500 (SPY) has reached record highs despite inflation and tariffs, but its cyclically adjusted price-to-earnings ratio is flashing a warning. This metric, mimicking patterns seen before the dot-com bubble, suggests investors should prepare for increased market volatility as valuations hover above historic norms.
Market context for this story
As of: WeekendLoading quotes…
Informational only — not investment advice. Full markets →

$SPYSPDR S&P 500 ETF
TradingView
Live chart & market data via TradingView · OppHub classroom · Delayed or exchange real-time per TradingView data agreements · Not investment advice
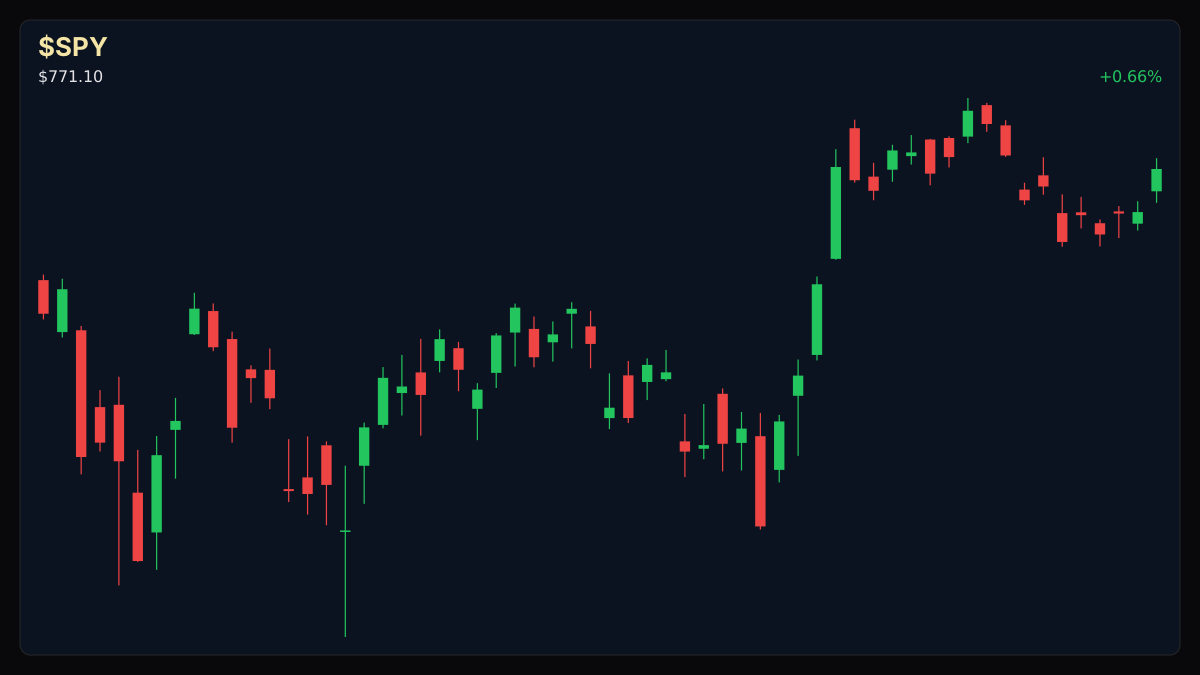
Educational TradingView chart — search any symbol in the widget. Confirm on /markets/SPY. Not investment advice.
Related markets
Shares a vertical MP4 loop to your phone's camera roll or app share sheet (Instagram, TikTok, Facebook Reels).
Despite persistent inflation and tariffs, major U.S. indices including the S&P 500 (SPY), Nasdaq Composite (IXIC), and Dow Jones Industrial Average (DJI) have achieved record highs. The S&P 500, in particular, has seen a surge of over 20%. However, historical analysis indicates a potential for increased volatility ahead.
The S&P 500's cyclically adjusted price-to-earnings (CAPE) ratio is exhibiting patterns similar to the dot-com bubble era of the early 2000s. This ratio, which reflects long-term valuation based on average inflation-adjusted earnings over a decade, has consistently remained above 40 since May 2026. While this metric does not predict the timing of downturns, its sustained elevated levels suggest historic valuation territory.
History suggests that remaining invested and focusing on quality stocks is a prudent strategy, even if the market is in a bubble. Analysis indicates that over every 20-year period since 1919, the S&P 500 has delivered positive total returns, underscoring the market's long-term resilience. Investors may want to focus on quality companies as they navigate potential volatility.
Read the full story
Original reporting and related coverage — attribution links only, not paid recommendations.
Trade this story
 Robinhood
 Webull
 Tradier
 IBKR
IBKR
Chart this story
 TradingView
Broker and exchange buttons use invite / refer-a-friend links (rewards may be capped). Charting links (TradingView) are partner offers that may pay OppHub America a commission at no extra cost to you.
OppSHOP
Full OppSHOP →As an Amazon Associate, OppHub America earns from qualifying purchases. Shopping here helps keep the site free — at no extra cost to you. Disclosure

OppSHOP
Related to this story
Investors seeking to navigate potential market volatility might consider
Shop related →

Investing books
Read the classics
Shop this pick →

Personal finance books
Run the household books
Shop this pick →

Trading notebooks
Write the thesis first
Shop this pick →

Monitor for charts
See every pane
Shop this pick →
Based on reporting from yahoo-tickers-tape-movers.
Informational and educational only — not investment, financial, or legal advice. Disclosure
Shares a vertical MP4 loop to your phone's camera roll or app share sheet (Instagram, TikTok, Facebook Reels).