Barry, OppHub America Desk · · Source: yahoo-tickers-tape-movers
Berkshire Hathaway Stock: Underperformance vs. S&P 500 Index
* Investors seeking market-tracking returns may find the S&P 500 Index, via ETFs like a more direct path to outperforming Berkshire Hathaway's historical compounded annual growth rate. * For those favoring Berkshire's strategy of operational growth and share buybacks, remains a significant holding, though investors should monitor its ability to capture growth drivers beyond its core businesses.
Based on reporting from yahoo-tickers-tape-movers.
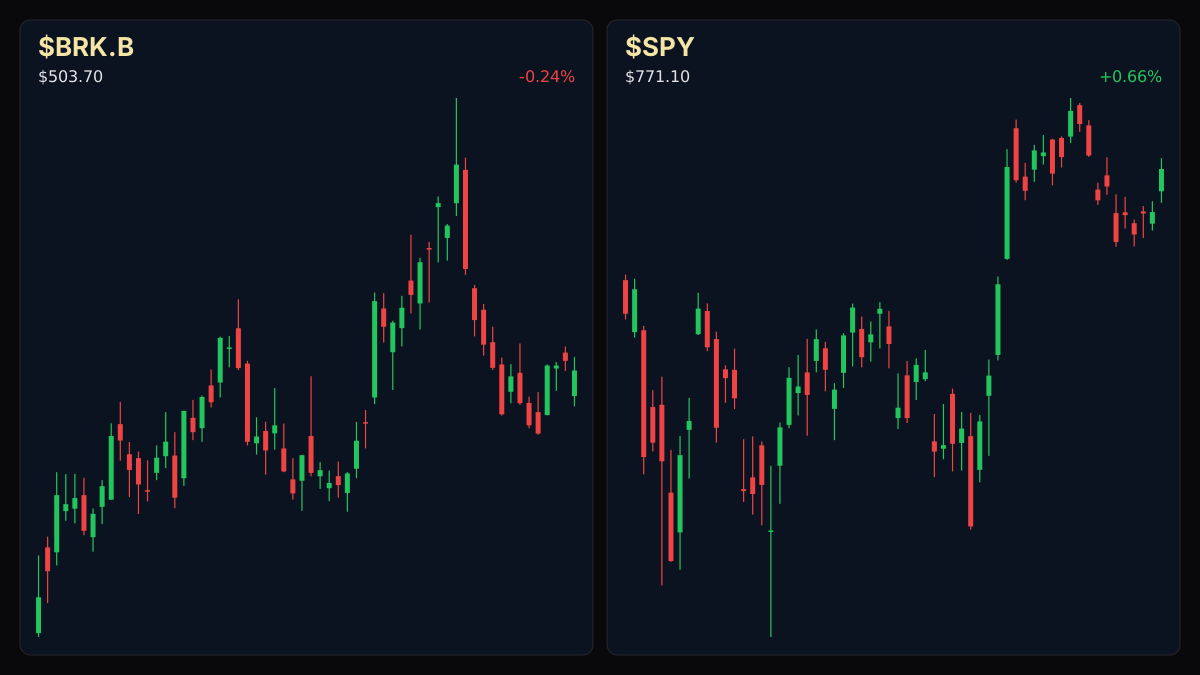
Berkshire Hathaway's Class B shares returned 13% annually over the past decade, tripling an initial investment. However, this performance lagged the S&P 500 Index's 15% annual return, which saw a $10,000 investment grow to over $41,300, highlighting a gap in investor returns.
Market context for this story
As of: WeekendLoading quotes…
Informational only — not investment advice. Full markets →


$SPYSPDR S&P 500 ETF
TradingView
Live chart & market data via TradingView · OppHub classroom · Delayed or exchange real-time per TradingView data agreements · Not investment advice
Educational TradingView chart — search any symbol in the widget. Confirm on /markets/SPY and related $BRK.B. Not investment advice.
Related markets
Shares a vertical MP4 loop to your phone's camera roll or app share sheet (Instagram, TikTok, Facebook Reels).
Berkshire Hathaway's (BRKB) B shares achieved a 13% annual compounded return over the ten years ending August 25, 2026, transforming a $10,000 investment into approximately $33,900. While a significant return, this performance fell short of the SPDR S&P 500 ETF Trust (SPY), which delivered a 15% annual return over the same period, turning a similar investment into about $41,300. The divergence is largely attributed to the S&P 500's exposure to high-growth technology and AI sectors, areas where Berkshire's operating businesses have less direct involvement. Berkshire's growth stemmed from expanding its own operations and share buybacks, leading to nearly tripled per-share earnings despite a 13% reduction in outstanding shares. Operating earnings grew from $17.6 billion in 2016 to $44.5 billion in 2025, bolstered by an increase in insurance float from $91.6 billion to $177.5 billion. Despite a dip in 2025 earnings from the prior year, the first half of 2026 showed a 17% increase year-over-year, with key segments like BNSF railroad and energy operations showing robust growth.
### Story Arc / How We Got Here
This follows our earlier coverage ([Berkshire Hathaway Scales Back Bank of America Stake, Boosts Delta](/explore/ceo-desk-berkshire-hathaway-scales-back-bank-of-america-stake-boosts-delta)) on 2026-08-21. Berkshire Hathaway, under CEO Greg Abel, reduced its stake in Bank of America by approximately 5.9%, a move worth about $1.7 billion. Concurrently, the conglomerate increased its holdings in Delta Air Lines by 44%, adding $1.6 billion. This strategic shift signals a reallocation within Berkshire's substantial U.S. equity portfolio. · * Watch Bank of America for potential price adjustments following a substantial stake reduction by Berkshire Hathaway. * Monitor Delta Air Lines for continued investor interest as Berkshire Hathaway significantly increased its position.
Read the full story
Original reporting and related coverage — attribution links only, not paid recommendations.
Trade this story
 Robinhood
 Webull
 Tradier
 IBKR
IBKR
Chart this story
 TradingView
Broker and exchange buttons use invite / refer-a-friend links (rewards may be capped). Charting links (TradingView) are partner offers that may pay OppHub America a commission at no extra cost to you.
OppSHOP
Full OppSHOP →As an Amazon Associate, OppHub America earns from qualifying purchases. Shopping here helps keep the site free — at no extra cost to you. Disclosure

OppSHOP
Related to this story
* Investors seeking market-tracking returns may find the S&P 500 Index,
Shop related →

Investing books
Read the classics
Shop this pick →

Personal finance books
Run the household books
Shop this pick →

Trading notebooks
Write the thesis first
Shop this pick →

Monitor for charts
See every pane
Shop this pick →
Story playbook
A pre-built map of what to watch — stocks, ETFs, and educational next steps. Not personalized advice.
Snapshot date: August 29, 2026 at 5:00 AM ET
This playbook was built when the story published and is not live-updated. Prices, news, and risk can change after this date — treat it as a starting map, not a current trade ticket.
Story → money map
large cap value vs broad market
Warren Buffett's company made a lot of money over the last ten years, but it actually grew slower than the overall U.S. stock market. Beginners care because putting money into a simple market tracker would have made more profit than holding this specific company stock.
What changed
Berkshire Hathaway's historical 10-year annualized return fell short of the S&P 500 benchmark due to lower exposure to high-growth tech and AI sectors.
Who wins / who loses
Broad-market index funds and technology-heavy portfolios win by outpacing traditional conglomerates.
Time horizon
Think in terms of the next few months.
Confidence & best fit
high confidence · Long-term investor
Safer theme exposure (ETFs)
Baskets that own the theme without betting on one company.
Single stocks (higher risk)
Primary = closest to the story · Peers = same industry · Second-order = knock-on effects · Avoid = looks related but may be a trap
Primary
- $BRK.BWatch — track, don’t rush
A great safe company, but it grows a bit slower than the whole stock market.
View $BRK.B chart → · End-of-day delayed data
Options (education only)
No strikes or expiries — a framework for how traders might express the view. Options can expire worthless.
Beginners should skip options here and simply buy and hold index funds for long-term growth.
See options-friendly brokers →Income / OppHub America angle
Not a trade tip — ways to use the insight outside the market.
- Focus on systematic monthly dollar-cost averaging into broad market index funds rather than single-stock picking.
What would break this thesis
- A significant shift in Berkshire Hathaway's capital deployment toward high-growth technology sectors or accelerated outperformance by its core operating businesses.
What to do next on OppHub America
Saved playbooks stay on this device for now.
Important
Not financial advice. OppHub America playbooks are educational market maps only — not recommendations to buy, sell, or hold any security. Markets move fast; information can be wrong or outdated. Trade and invest at your own risk. Do your own research or consult a licensed advisor.
Based on reporting from yahoo-tickers-tape-movers.
Informational and educational only — not investment, financial, or legal advice. Disclosure
Shares a vertical MP4 loop to your phone's camera roll or app share sheet (Instagram, TikTok, Facebook Reels).