Barry, OppHub America Desk · · Source: yahoo-megacap-tickers
S&P 500 Gains 1.69% as Market Shrugs Off Headwinds
• Watch $EVR+WL and $GS+WL for potential insights into market sentiment and AI capital expenditure trends. • Consider broad market exposure via index funds as the S&P 500 demonstrates continued upward momentum.
Based on reporting from yahoo-megacap-tickers.
Stocks climbed Monday as a top Wall Street veteran argued the market is resilient, shrugging off geopolitical events and interest rate concerns. The S&P 500 gained 1.69%, driven by strong corporate earnings and consumer spending. Investors are watching AI-driven capital expenditures and overall profit growth.
Market context for this story
As of: Regular HoursLoading quotes…
Informational only — not investment advice. Full markets →


$SPYSPDR S&P 500 ETF
TradingView
Live chart & market data via TradingView · OppHub classroom · Delayed or exchange real-time per TradingView data agreements · Not investment advice
Educational TradingView chart — search any symbol in the widget. Confirm on /markets/SPY and related $EVR, $GS. Not investment advice.
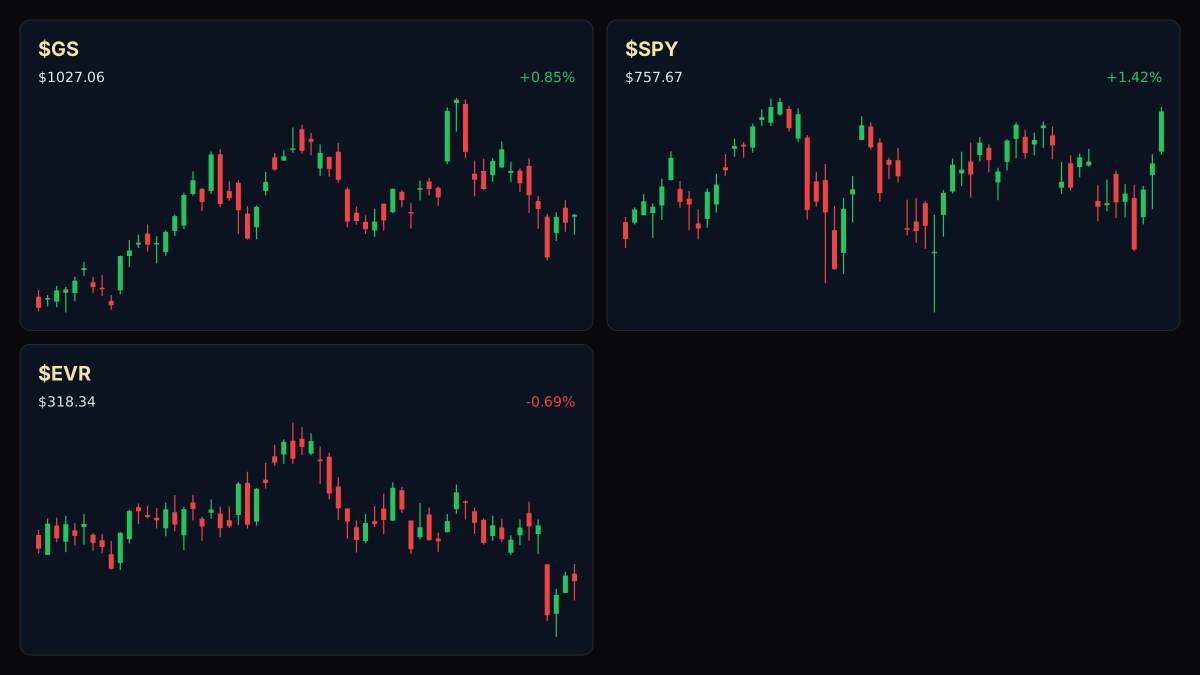
Related markets
Shares a vertical MP4 loop to your phone's camera roll or app share sheet (Instagram, TikTok, Facebook Reels).
**Implied Volatility / Movement:** Normal The stock market is demonstrating resilience, shrugging off geopolitical tensions and rising interest rates, according to Roger Altman, founder and senior chairman of Evercore. The S&P 500 closed Monday up 1.69%, with the Dow Jones Industrial Average and Nasdaq Composite also posting significant gains. This market strength is underpinned by robust corporate profitability and solid consumer spending.
Corporate profits reached a record $4.427 trillion in the first quarter of 2026, a 13% year-over-year increase, with 86% of S&P 500 companies exceeding consensus estimates. Consumer spending rose 3.2%, with goods spending up 5.2%, indicating strong underlying economic activity. Despite concerns, the VIX index remained within a normal range at 17.09 as of July 30, 2026.
While the market appears to be absorbing headwinds, significant capital expenditures related to artificial intelligence continue to be a focal point, with hyperscalers consuming approximately 95% of operating cash flows. Projected AI spending is expected to reach $2.1 trillion through 2027.
Read the full story
Original reporting and related coverage — attribution links only, not paid recommendations.
Trade this story
 Robinhood
 Webull
 Tradier
 IBKR
IBKR
Chart this story
 TradingView
Broker and exchange buttons use invite / refer-a-friend links (rewards may be capped). Charting links (TradingView) are partner offers that may pay OppHub America a commission at no extra cost to you.
OppSHOP
Full OppSHOP →As an Amazon Associate, OppHub America earns from qualifying purchases. Shopping here helps keep the site free — at no extra cost to you. Disclosure

OppSHOP
Related to this story
Watch $EVR and $GS for potential insights into market sentiment and AI c
Shop related →

Investing books
Read the classics
Shop this pick →

Personal finance books
Run the household books
Shop this pick →

Trading notebooks
Write the thesis first
Shop this pick →
Monitor for charts
See every pane
Shop this pick →
Story playbook
A pre-built map of what to watch — stocks, ETFs, and educational next steps. Not personalized advice.
Snapshot date: August 3, 2026 at 5:11 PM ET
This playbook was built when the story published and is not live-updated. Prices, news, and risk can change after this date — treat it as a starting map, not a current trade ticket.
Story → money map
market resilience and AI spending
The stock market went up because companies made a lot of money and people are still spending freely, ignoring worries about world events and interest rates. Investors care because companies are spending huge amounts of money on artificial intelligence.
What changed
The S&P 500 rose 1.69% supported by record corporate profits and solid consumer spending despite macro headwinds.
Who wins / who loses
Large tech firms and financial advisors benefit from market resilience and high AI spending, while cautious investors face FOMO or overexposure risk.
Time horizon
Think in terms of the next few weeks.
Confidence & best fit
medium confidence · Long-term investor
Safer theme exposure (ETFs)
Baskets that own the theme without betting on one company.
Single stocks (higher risk)
Primary = closest to the story · Peers = same industry · Second-order = knock-on effects · Avoid = looks related but may be a trap
Primary
- $EVRWatch — track, don’t rush
This is the investment bank run by the Wall Street veteran who pointed out the market's strength.
View $EVR chart → · End-of-day delayed data
Peer
- $GSWatch — track, don’t rush
A major Wall Street bank that reflects overall market health and investor confidence.
View $GS chart → · End-of-day delayed data
Second-order
- $MSFTBuild slowly — only if it fits your plan
A massive tech giant spending heavily on artificial intelligence to capture future growth.
View $MSFT chart → · End-of-day delayed data
Options (education only)
No strikes or expiries — a framework for how traders might express the view. Options can expire worthless.
Beginners should skip options here and stick to buying broad market index funds if they want to participate.
See options-friendly brokers →Income / OppHub America angle
Not a trade tip — ways to use the insight outside the market.
- Review personal portfolio diversification to ensure exposure matches risk tolerance during market rallies.
What would break this thesis
- A sharp spike in the VIX index above normal ranges.
- A sudden deterioration in corporate earnings or consumer spending data.
What to do next on OppHub America
Saved playbooks stay on this device for now.
Important
Not financial advice. OppHub America playbooks are educational market maps only — not recommendations to buy, sell, or hold any security. Markets move fast; information can be wrong or outdated. Trade and invest at your own risk. Do your own research or consult a licensed advisor.
Aftermath · $NVDA
+5.15% vs write
- •Since this piece: $NVDA is up +5.15% vs $196.51 at write time (now $206.64).
- •Session move (Yahoo delayed): +2.93%.
- •RSI14 at write was 49.7 — compare levels on Markets, not advice.
- •Original money play lens: Alphabet's (NASDAQ:GOOGL) strong revenue growth and cloud expansion warrant attention despite capex concerns. Watch levels around $330.20 for potential support.
- •Track $NVDA live on OppHub Markets (/markets/NVDA). Not financial advice.
Based on reporting from yahoo-megacap-tickers.
Informational and educational only — not investment, financial, or legal advice. Disclosure
Shares a vertical MP4 loop to your phone's camera roll or app share sheet (Instagram, TikTok, Facebook Reels).